Designing the Data Platform for Travel Triangle
Unified Analytics for a Three-Sided Marketplace
In 2016, When Travel Triangle approached me to design their analytics platform, I was an outsider to the travel industry. However, my expertise in user analytics, AI, and experience building data platforms for companies like PayU and Zynga gave me the perfect toolkit to tackle their unique challenges.
As a three-sided marketplace connecting travelers, travel agents, and an internal operations team, Travel Triangle had a wealth of user data flowing through multiple touchpoints—website visits, app interactions, booking behaviors, customer service calls, emails, and more. What they lacked was a unified way to capture, analyze, and leverage this data to drive business decisions.
Starting from First Principles
My approach to building any data platform follows these fundamental steps:
Understand the business deeply: Before writing a single line of code, I spent weeks understanding Travel Triangle's business model, key metrics, and growth bottlenecks. Sanchit and Sankalp gave me unrestricted access to their data, their people, and their business processes.
Map the user journey: I documented every touchpoint in the customer journey—from first website visit to post-trip feedback—to ensure we captured meaningful data at each stage.
Design for integration: The platform needed to integrate with existing systems while being flexible enough to accommodate future tools and data sources.
Build for scale: With rapidly growing user numbers, the platform had to handle increasing data volumes without performance degradation.
The Challenges
The folks at Travel Triangle were high-IQ, data-driven people. And the hierarchy was fairly flat— DATA and ANALYTICS used to drive their decisions, not someone's designation. However, to my good fortune, even they were facing problems in DATA and ANALYTICS.
1. "Aaja Shaam Hone Aayi, Data To De De Bhai"
Slowwwww The existing setup was using Qliksense fed via ETL processes. It was quite painful to query and no fun to build or drill through the data. I hated it.
2. "Hum Alag Alag Hain"
Mismatch Clevertap data wouldn't match Qliksense data, both wouldn't match with GA data, and there was no way to reconcile easily or quickly. It was like three different movies playing at once!
This meant marketing, business, and product teams were presenting different data. Virgin analysts would be sacrificed daily at the altar of Data Gods to gain unholy power to see through dirty data. "Mogambo khush hua" when the numbers finally matched! (We had two Mogambos - Vishnu and Kartik)
3. "Main apne sapno ka mahal bana raha hoon... ek rupaye ki eet se."
Frugality Travel Triangle was a frugal company (like Amazon, Reliance). I was told that the founders believed in investing in people and not software licenses. So suggesting Tableau for all 50 decision-makers/managers was a non-starter. We wanted to democratize data to as many employees as possible, so we decided to build something on open-source. Thankfully, I found Superset—which was a new kid on the block then. Otherwise, we might have had to make one in-house. Phew!
4. "Babul Ki Duaayein Leti Jaa, Ja Tujhko Sukhi Sansaar Mile"
Team churn We faced team churn as some of their well-loved, rockstar analysts were leaving for higher studies. It was like losing your favorite characters mid-season!
The Architecture:
Rather than building just another data warehouse, I designed a comprehensive analytics ecosystem with a clear layered architecture. This help us with trusting data that we were capturing. And data discrepancies were a thing of the past. Thanks to huge support from Piyush and Prabhat, we were able to build this.
During my research, I found Segment as a good data router, but Segment pricing was per user. But Travel Triangle's blog couldn't be covered via Segment due to its large traffic base, so we chose Google Tag Manager for it. "Ek Chutki Sindoor Ki Keemat" we understood—sometimes you have to make practical choices! (The value of a pinch of vermillion)
P.S. Segment/GTM were later replaced with RTMS (Real-Time Messaging Stream) as data volumes grew.
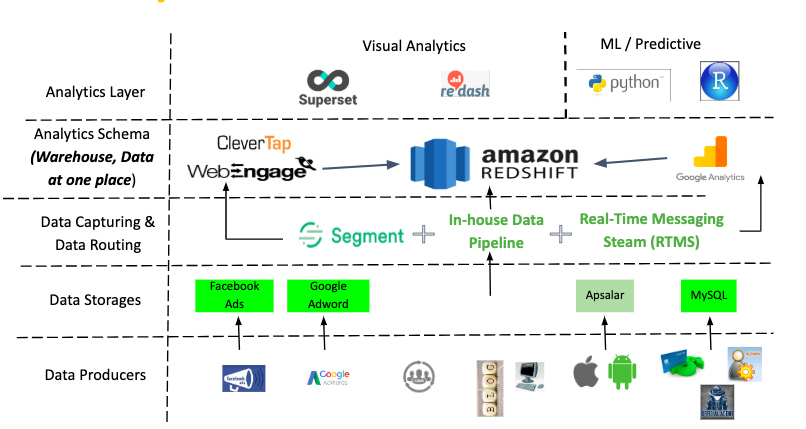
Layer 1: Data Producers
At the foundation were the various data sources generating valuable user information:
- Web platforms (desktop and mobile web)
- Mobile applications (iOS and Android)
- CRM systems
- Call center platforms
- Marketing tools (Facebook Ads, Google Adwords)
- Internal operations systems
Layer 2: Data Storage
We needed to capture and store data from multiple transactional databases:
- MySQL for core application data
- Apsalar for mobile analytics
- Marketing platform databases
- CRM databases
Layer 3: Data Capturing & Routing
This crucial middleware layer connected our data sources to our centralized warehouse:
- Segment: Initially used as our primary data router for user events across platforms
- In-house Data Pipeline: For syncing MySQL and other structured data sources
- Real-Time Messaging Stream (RTMS): An in-house solution that eventually replaced Segment as data volumes grew
Layer 4: Analytics Schema
The heart of our architecture was the centralized data repository:
- Amazon Redshift: Our primary data warehouse for structured analytics data
- WebEngage and CleverTap: For user engagement analytics and campaign management
- Google Analytics: For web analytics integration
Layer 5: Analytics Tools
The top layer provided business users with access to insights:
- Visual Analytics:
- Superset for interactive visualizations and dashboards
- Redash for SQL-based reports and charts
- ML/Predictive Analytics:
- Python-based data science workbenches
- R for statistical analysis and modeling
What made this architecture powerful was its modularity and scalability. Each layer could evolve independently as the company's needs changed, while maintaining the core flow of data from source to insight.
Getting to Know the Business
In my initial days at Travel Triangle, I spent quite a few weeks understanding different teams. Because I knew product, but I didn't understand Digital Marketing and Operations then. So, I sat with in-house teams, even took inbound customer calls, and met travel agents in NCR—both big and small.
Thankfully, we soon found Tushar, who had great people skills and technical chops, to head the Analytics Team. Hence, I was able to focus on the NEW architecture, while he built key relationships with the teams and helped them with both OLD and NEW systems.
Key Features Implemented:
With this infrastructure in place, we were able to build several critical capabilities:
360-Degree User Analytics The real power came from connecting cross-device and cross-platform user journeys. We built user profiles that combined behavioral data (browsing patterns, search preferences), transaction data (booking history, spend), and interaction data (customer service touchpoints, feedback).
Smart Algorithms for Business Optimization With the data foundation in place, we implemented several AI-driven systems:
- Dynamic lead scoring: Real-time scoring of incoming leads based on conversion probability
- Personalized recommendations: Suggesting destinations and packages based on user behavior
- Churn prediction: Identifying at-risk travelers and agents before they abandoned the platform
Accessible Analytics for Business Users A data platform is only valuable if it drives action. I designed intuitive dashboards for different stakeholders:
- Marketing team could track campaign performance and acquisition costs
- Product managers could analyze feature adoption and user flows
- Operations team could monitor marketplace health metrics
- Leadership could access high-level KPIs and trends
Results and Impact:
Within six months of implementation, the platform delivered significant business impact:
- Improved marketing efficiency: Identified acquisition channels with 30-40% higher customer lifetime value
- Enhanced agent performance: Smarter lead distribution increased conversion rates by 25%
- Product optimization: Data-driven feature prioritization led to higher engagement metrics
- Better customer experience: Personalization algorithms improved customer satisfaction scores
The Goodbyes:
Apart from making lifelong friends, the most rewarding aspect was helping Travel Triangle build their internal data capability.
- I helped Sanchit hire the Head of Analytics, Tushar.
- Then I helped Tushar build out the analytics team.
- Created documentation and playbooks for ongoing platform development.
Looking Back:
My experience with Travel Triangle reinforced several principles about building effective data platforms:
- Start with the business questions, not the technology
- Invest in data quality early—it's far more costly to fix later
- Make analytics accessible to non-technical users through intuitive interfaces
- Build for the future, with systems that can evolve as the business grows
- Foster a data-driven culture alongside the technical infrastructure